Client Outcomes Data
DHCS collects individual-level data as a part of its opioid response from some projects that provide direct treatment services. This data helps DHCS understand how client outcomes change while accessing services.
Learn more about how and why this data is collected at the bottom of this page.
Decrease in Drug Use
For client surveys collected between October 2020 – September 2022:
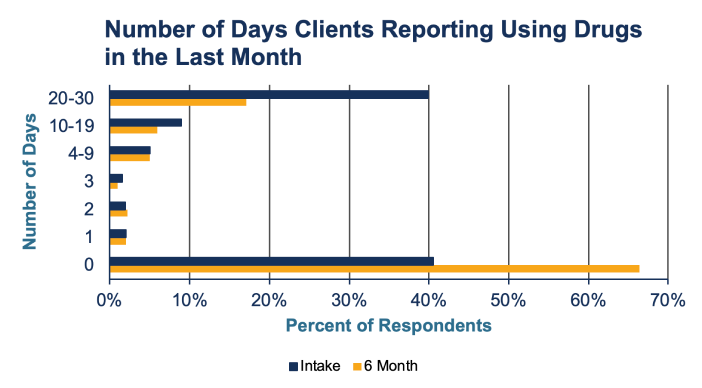
Six months after the initial treatment intake survey, clients experienced a decrease in the number of days they reported using drugs in the last month.
58%decrease in clients reporting using drugs 20-30 days in the last month
61%increase in clients reporting no drug use

https://spars-csat.samhsa.gov/ | Dates Represented: 10/2020-9/2022 | Date Downloaded: 9/30/2022
Increase in Housing for Clients
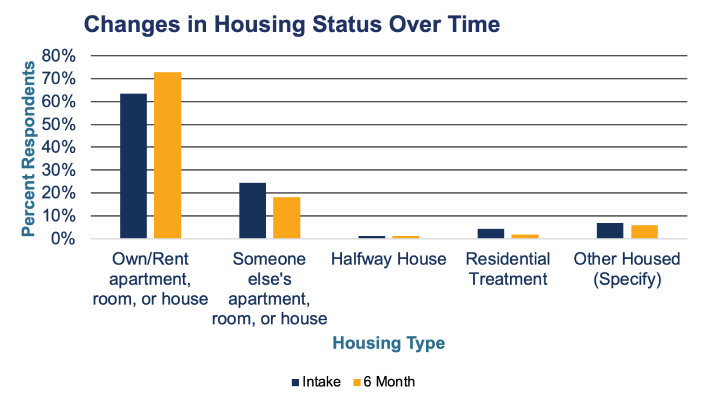
Before receiving treatment services, 13% of respondents reported being unhoused. After 6 months, only 7% reported being unhoused. In addition, after receiving services, more clients reported having their own apartment, room or house, and fewer clients reported living in someone else’s apartment, room or house.
16%increase in clients reporting living in their own apartment, room or house
28%decrease in clients reporting living in someone else’s apartment, room or house

https://spars-csat.samhsa.gov/ | Dates Represented: 10/2020-9/2022 | Date Downloaded: 9/30/2022
Increase in Employment
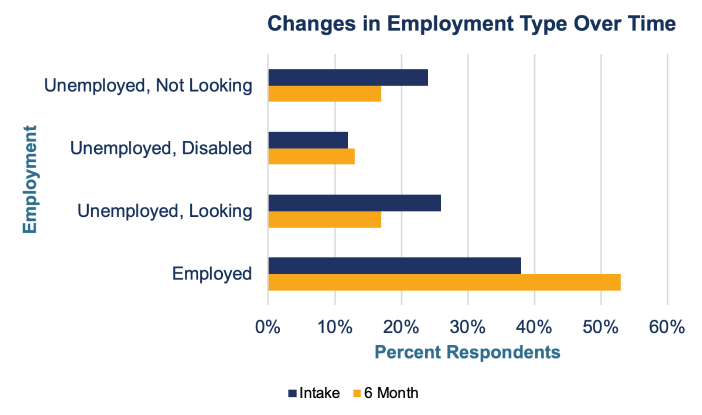
Clients who remained in treatment services had an increase in reporting full or part-time employment and decreases in reporting unemployment.
40%increase in clients reporting being employed

https://spars-csat.samhsa.gov/ | Dates Represented: 10/2020-9/2022 | Date Downloaded: 9/30/2022
How was this data collected?
DHCS receives State Opioid Response (SOR) grant funding from the Substance Abuse and Mental Health Services Administration (SAMHSA). SAMHSA requires that all SOR grantees who provide direct services must collect data on all clients receiving services or medications funded with SOR dollars. Grantees must collect data through the Government Performance and Results Act (GPRA) survey.
Grantees conduct the GPRA survey with individuals accessing treatment and recovery services in SOR-funded programs at intake, six-month follow-up, and discharge. The survey measures a variety of outcomes, including substance use, mental and physical health, living conditions, and employment status. The data is used to evaluate program success.
The data shared above was collected between October 1, 2020 – September 30, 2022. Surveys were collected from 157 sites across the state and represent 9,853 individuals.
Under the SOR grant in California, seven programs were subject to GPRA requirements during the analysis time period. These programs were:
